

 Demo
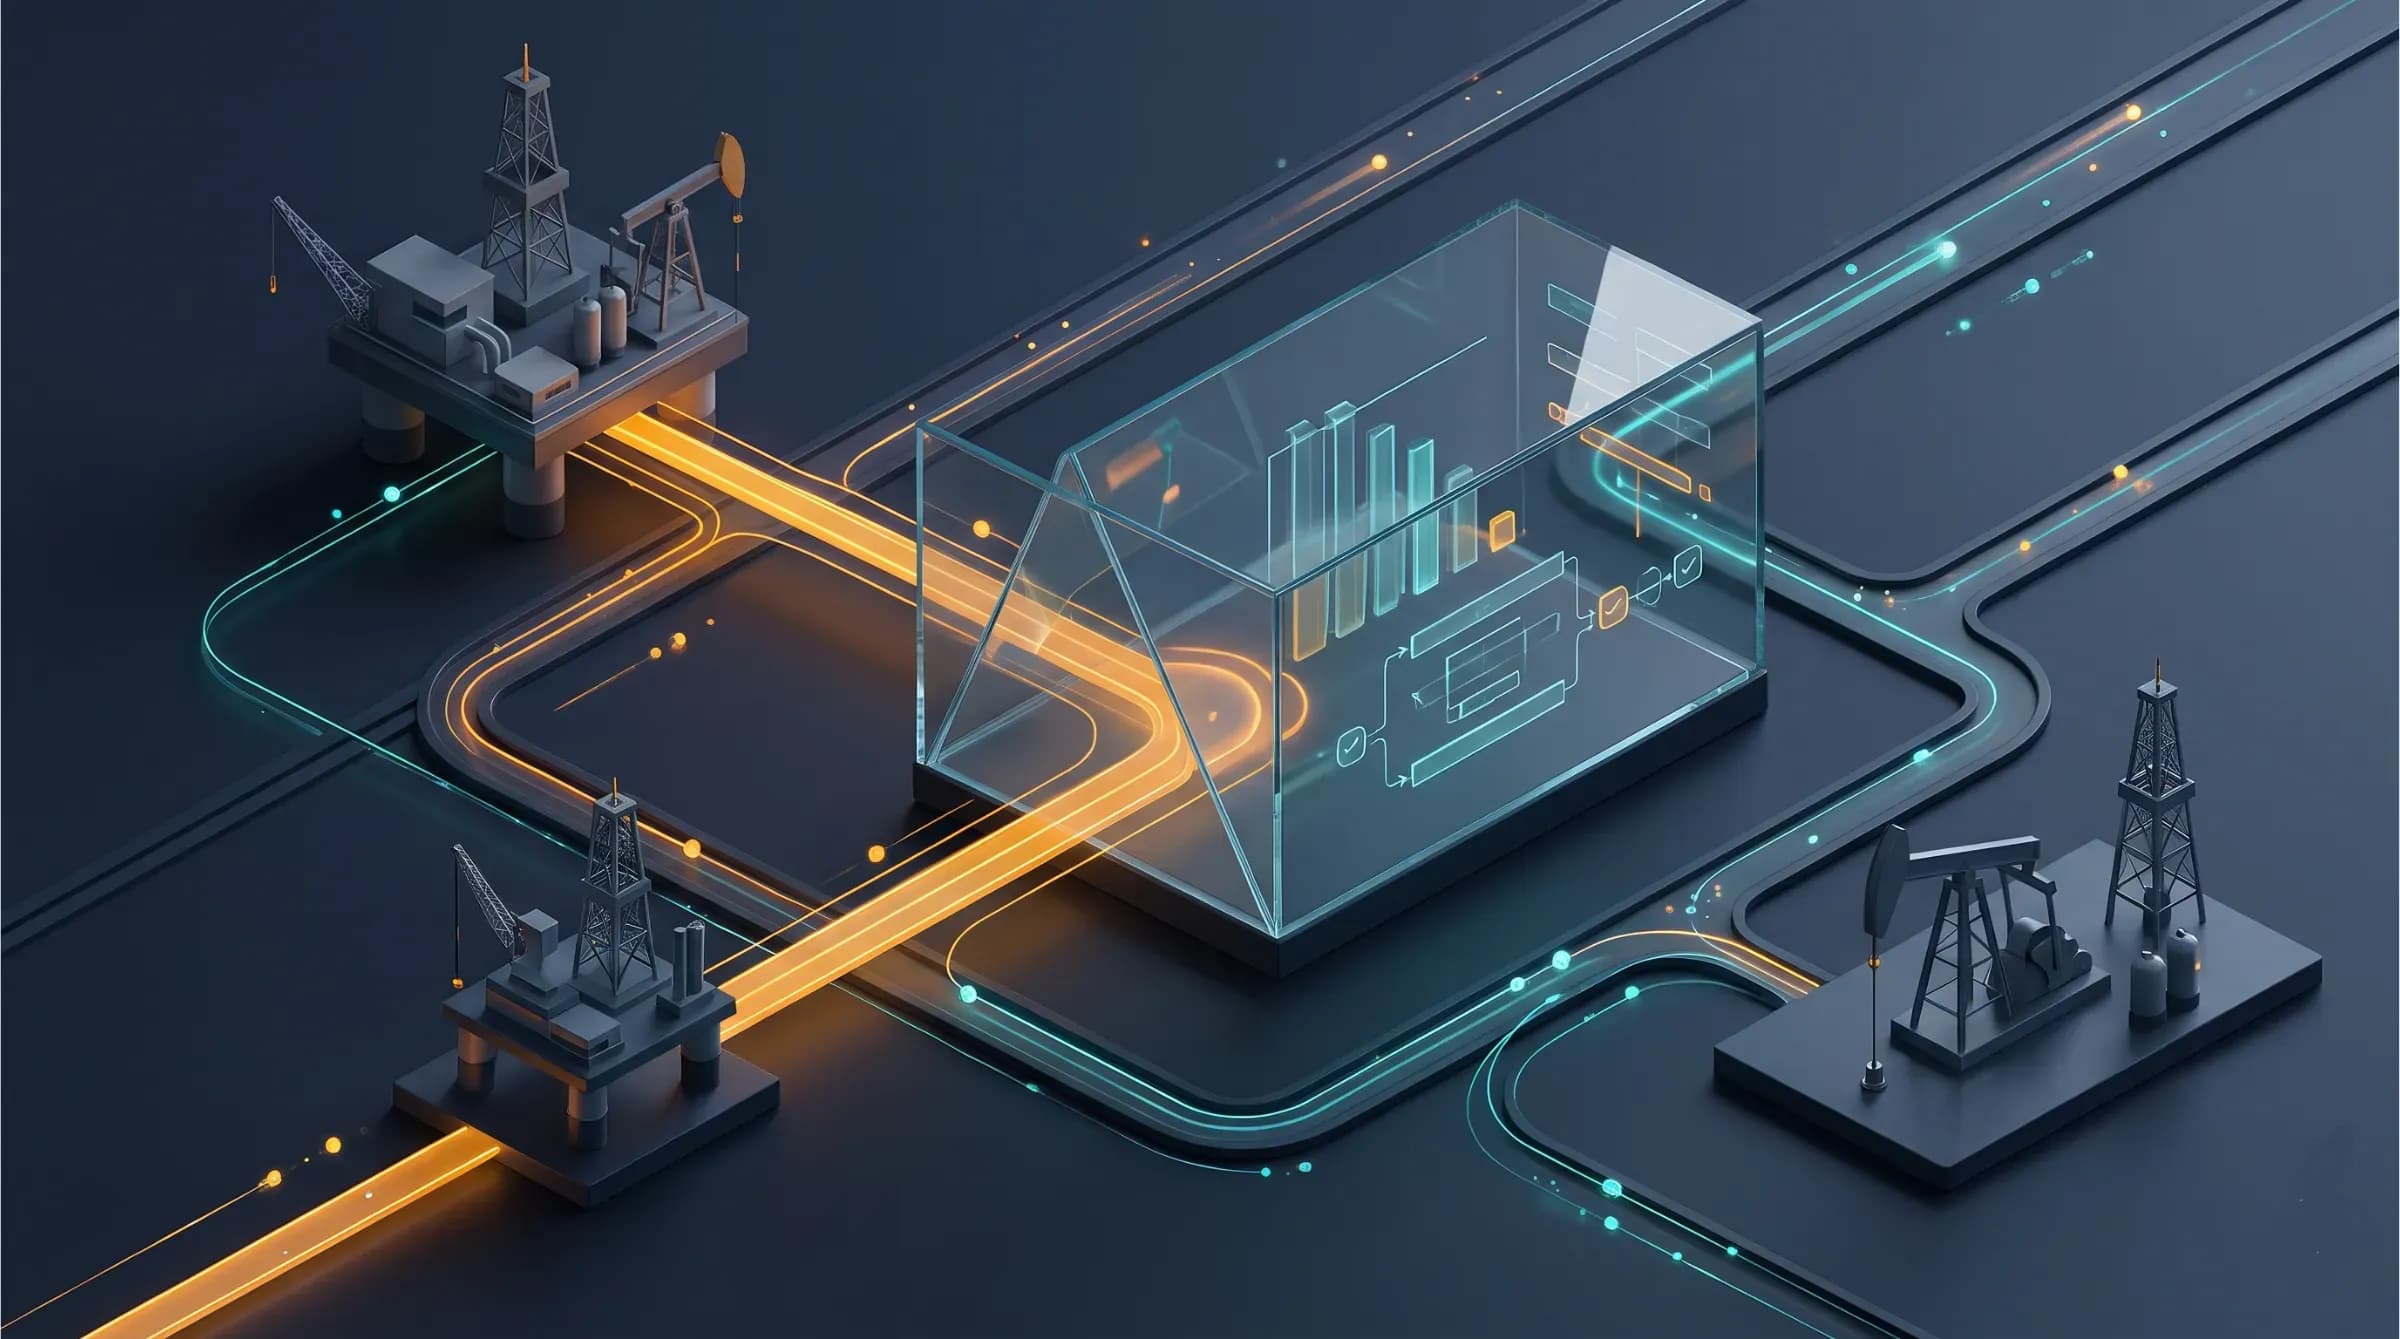
Introducing Holocron: MangoBytes AI’s In-House Platform for Agent Governance and Tracing
AI agents are changing how work gets done. They can gather information, call tools, coordinate with other agents, and turn complex requests into actionable answers.
But as agents take on more responsibility, a new question emerges: How do we understand what happened when an agent completes a task—or when something goes wrong?
A final answer tells only part of the story. Behind it may be several model calls, a database query, an external tool, and a handoff to another agent. If the answer is slow, incomplete, or incorrect, teams need to look beyond the response to understand why.
That is why we built Holocron, MangoBytes AI’s in-house platform for tracing, evaluating, and governing AI agent workflows.
From an Answer to the Full Story
Imagine an operations team asks an AI agent to identify wells that may need attention. The agent retrieves production data, calls an analysis tool, and prepares a summary for an engineer.
Now imagine the summary arrives late, or a well is missing. Was the underlying data unavailable? Did a tool return an error? Did the agent select the wrong tool? Or did the workflow simply take longer than expected?
Without visibility into the steps, answering these questions can mean piecing together logs across multiple systems. Holocron brings the execution journey into one place, helping teams follow a request from the initial agent interaction through model calls, tools, and the final response.
Why Agent Workflows Need a Different View
A conventional application often follows a predictable sequence: receive a request, apply business logic, query a database, and return a response. An agent may take a different path for each request. It can decide which information to retrieve, choose among tools, make multiple model calls, or hand work to another agent.
That flexibility is valuable, but it also makes investigation more complex. A successful HTTP response does not necessarily mean the task was completed well. An agent might produce a fluent answer using incomplete information, call an unnecessary tool, or take too long to respond.
Teams therefore need to ask questions at several levels:
- Execution: Which steps ran, and where did time get spent?
- Reliability: Which failures are recurring, and what changed between releases?
- Quality: Was the answer complete and supported by the available information?
- Efficiency: How many tokens were used, and what did the workflow cost?
- Governance: Who can see the recorded data, and what information is retained?
Holocron brings these questions together around the actual execution of the agent.
What Is Holocron?
Holocron is MangoBytes AI’s in-house AI governance and trace platform. It gives our teams a shared foundation to understand agent execution, investigate issues, evaluate behavior, and manage access to recorded workflow data.
Built as a lightweight, self-hosted platform, Holocron is designed for applications using the OpenAI Agents SDK and also accepts OpenTelemetry traces. Its governance capabilities bring together visibility, evaluation, access controls, and data handling policies across the agent lifecycle.
It captures the steps of an agent workflow as traces and spans, giving teams a way to investigate behavior, measure performance, and evaluate changes over time.
With Holocron, teams can:
- Trace agent workflows: See model calls, tool invocations, handoffs, database operations, errors, and other recorded steps in a hierarchical view.
- Investigate issues: Group recurring failures, review representative traces, and use topology-aware hints to focus an investigation.
- Understand performance and cost: Explore latency, token usage, estimated costs, errors, and feedback across projects and environments.
- Evaluate changes: Create datasets, collect human annotations, run evaluators, and compare replay experiments across prompts or models.
- Monitor what matters: Configure alert rules for signals such as error rate, latency, cost, and issue occurrences.
Follow a Request Through the Agent Journey
Consider a production surveillance agent asked: “Which wells showed the largest production decline this month, and what should we investigate?”
A workflow might retrieve production history, calculate changes, look up well details, and prepare an explanation. Holocron records the instrumented steps as a trace. Each individual operation within that trace is a span, connected to its parent so the team can see how the work fits together.
A simplified journey might look like this:
User request
└── Production surveillance agent
    ├── Model call: interpret the request
    ├── Database operation: retrieve production history
    ├── Tool call: calculate production changes
    ├── Model call: prepare the explanation
    └── Response
In the trace waterfall, teams can inspect the recorded timing, status, and available details for each step. If the request was slow, they can identify which operation consumed time. If a tool failed, they can inspect that part of the workflow in context instead of starting with the final answer alone.
The view depends on what the application instruments and what its capture policy allows. Holocron can retain structural telemetry even when payload capture is disabled.
See Where the Workflow Needs Attention
A single agent request can involve many moving parts. Holocron's trace waterfall shows their relationships, making it easier to follow the path from request to response and locate a slow or failing step.
For example, if a production analysis workflow fails, a team can inspect the recorded trace to see whether the failure occurred during a model call, a tool invocation, or a database operation. Recurring errors can be grouped into issues, helping the team track them across occurrences and releases.
Holocron groups similar errors using stable issue fingerprints, so repeated occurrences can be investigated together. An issue includes details such as when it was first and last seen, its occurrence history, and a representative trace. Teams can assign an issue and track it through states such as investigating or resolved.
The platform also provides root-cause hints based on the trace's structure. For example, when a parent agent reports an error because a child tool failed, the failing tool may be a more useful place to begin. These are investigation hints—not a guarantee of root cause, especially when several independent failures appear in the same trace.
Holocron can also compare releases using measures such as error rate, latency, cost, and recorded scores. This gives teams a clearer view of whether a change improved the workflow or introduced a regression.
Understand Latency, Tokens, and Cost
An agent that produces a useful answer still needs to do so within a practical time and cost. Holocron provides analytics for trace volume, errors, latency, token usage, and estimated cost, with filters that help teams examine activity by dimensions such as project, environment, model, agent, or release.
For example, a team might notice that a new release has a higher p95 latency—the response time below which 95% of measured requests fall. They can compare releases and inspect slower traces to see whether the difference is associated with model calls, tools, or other recorded operations.
When model usage is available and a source does not report cost, Holocron can estimate it using configured pricing snapshots. Those snapshots retain pricing provenance, helping teams understand which pricing configuration was used. Estimates depend on the usage and pricing information available; they are not a substitute for a provider invoice.
Move From Observation to Evaluation
Seeing what happened is the first step. Knowing whether an agent performed its task well is the next.
Holocron supports evaluation datasets built from examples teams care about, including examples linked to source traces. Teams can add human annotations and run deterministic checks for measures such as errors, latency budgets, cost budgets, and tool success.
For questions that require semantic judgment, model-backed evaluators can assess dimensions such as correctness, groundedness, tool selection, and completeness. These evaluations are signals for review, and their usefulness depends on the examples, context, and criteria provided.
Replay experiments let teams run dataset items against a configured target and compare results. A team refining an operations agent, for example, can use a representative set of questions to examine changes in scores, latency, and errors before deciding what to investigate further.
A Practical Evaluation Loop
A team improving the production surveillance agent could follow a repeatable cycle:
- Collect representative questions, including examples where users reported incomplete or unexpected answers.
- Add the examples to an evaluation dataset and annotate what a useful response should contain.
- Replay the dataset against a configured application endpoint or a direct prompt-and-model target.
- Review recorded outputs, errors, latency, and evaluator scores alongside human feedback.
- Compare experiments and investigate regressions before choosing the next change.
This makes evaluation part of an ongoing improvement process. It also keeps the original examples available for future comparisons as the agent evolves.
Stay Ahead of Repeated Problems
Teams should not have to wait for every user to report a problem. Holocron supports configurable threshold alerts for error rate, p95 latency, average cost, trace count, and issue occurrences. Rules can use defined windows and filters, with notifications delivered through HTTPS webhooks.
For example, a team can configure an alert when an agent's error rate crosses a chosen threshold in production. They can then use the issue inbox and related traces to investigate the underlying occurrences. Saved searches and dashboard definitions help teams return to views they use regularly.
Governance Built Into the Agent Lifecycle
Governance begins with knowing what an agent did and having the context to review it. Holocron connects execution traces with issue investigation, evaluations, feedback, and release comparisons. Together, these give MangoBytes AI teams evidence to examine behavior and make informed decisions as workflows evolve.
Access and data handling are part of that process. Project roles define who can work with project data, while environment-specific ingestion keys and configurable redaction help control what enters the platform and what is stored. Audit logs provide a record of relevant platform changes. Human review remains essential: traces and evaluation scores support judgment, and do not independently establish that an answer or workflow is correct.
Built for Control and Simplicity
Holocron is self-hosted and PostgreSQL-first. Its default runtime consists of one application container and PostgreSQL, keeping the core deployment small while leaving room for optional integrations.
The platform supports project-level access controls, separate ingestion keys for projects and environments, and configurable redaction before data is persisted. The repository also includes an Azure deployment baseline with private PostgreSQL networking.
For human access, Holocron supports project memberships and roles. Machine ingestion uses separate, scoped keys for each project and environment. Teams can configure secret masking, optional common personal-information masking, custom redaction keys, and payload-capture policies before data is persisted.
Retention policies can be set by project and environment, with optional archival of already-redacted traces to Azure Blob Storage. Holocron also accepts OTLP traces and can optionally export telemetry, allowing it to fit alongside existing observability tools.
These capabilities help teams decide how to operate Holocron and manage the data captured from their agent workflows.
Building Trust in Agentic AI
As AI agents become part of everyday workflows, teams need more than a final answer. They need to understand how that answer was produced, investigate failures, and measure whether changes make the experience better.
For MangoBytes AI, Holocron brings those pieces together in an in-house governance and trace platform: visibility into execution, tools for investigating issues, and a foundation for evaluating agent behavior over time.
Better visibility. More informed evaluation. More confident AI workflows.